Debugging
Dryad Engine provides two main debugging tools: the native browser console and the built-in Debug Panel.
Browser Console
Since Dryad Engine is web-based and runs in Electron, all standard web development practices apply. You can use the browser's developer tools to debug your game.
Opening the console:
- File → Toggle Developer Tools (
Ctrl+Shift+I)
The console shows errors, warnings, and log messages from both the engine and your scripts.
Engine Logger
The engine uses a structured logging system with colored output and importance levels:
| Level | Color | Use |
|---|---|---|
| INFO | Blue | General messages |
| SUCCESS | Green | Successful operations |
| OVERWRITE | Brown | Data overwrites(e.g you want to overwrite an action's default behavior) |
| WARN | Yellow | Warnings |
| ERROR | Red | Errors |
When dev mode is enabled, log messages also show the source file and line number, making it easy to trace where code was called from.
Debug Panel
The Debug Panel is visible automatically when playtesting your game from the Engine Editor. It provides a visual interface to inspect and manipulate game state without writing code.
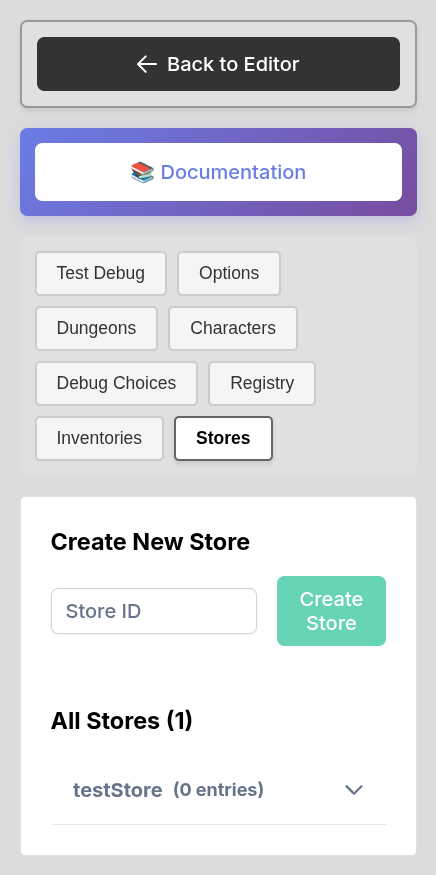
What You Can Inspect
- Characters - View and modify character stats, resources, traits, and statuses
- Inventories - Browse items, add/remove items, check equipment
- Dungeons - See current dungeon, room, and scene data
- Flags - View and modify game flags
- States - Check current UI and game states
- Registry - See all registered events, actions, conditions, placeholders, stat computers, and components
Custom Debug Buttons
You can add custom debug buttons that appear in the Debug Panel. These are useful for testing specific scenarios like giving items, teleporting, or triggering events.
Add custom debug buttons in the Engine Editor:
- Go to General → Custom Choices
- Create choices with the
debuggroup - These appear as buttons in the Debug Panel during playtest
Example uses:
- "Give 1000 Gold" - quickly test shop purchases
- "Max All Stats" - test endgame content
- "Trigger Boss Fight" - skip to specific encounters
Checking Dev Mode in Scripts
You can check if dev mode is enabled using game.isDevMode():
if (game.isDevMode()) {
  console.log('Debug info:', someData);
}
Tips
- Keep the console open during development to catch errors early
- Use the Debug Panel's Registry tab to verify your custom registrations are working
- Create debug buttons for common testing scenarios to speed up iteration
- Check the Network tab in Developer Tools if assets aren't loading